Moving Type
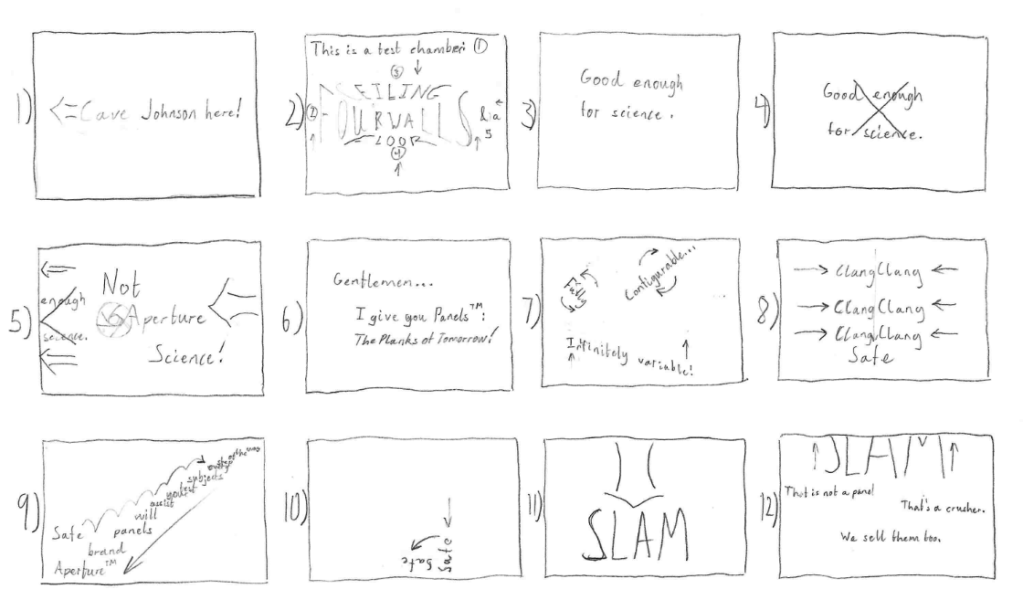
As part of our next assignment in Art 48, we’ll be working with kinetic typography, so we need to select an audio sample to work with. I’ve chosen to use the audio from Aperture Investment Opportunity #1: “Panels”:
Animated Infographic Final 2
Animated Infographic Final
Infographic Progress 3
Infographic Progress 2

Infographic Progress


Animated Infographic WIP 1
2nd Project
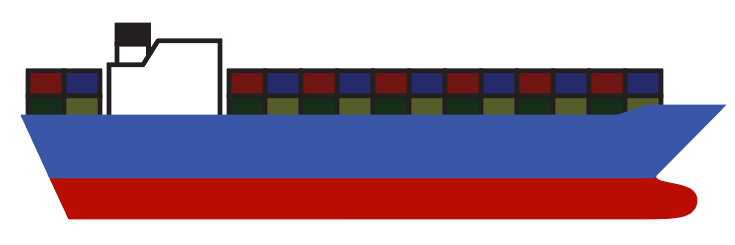
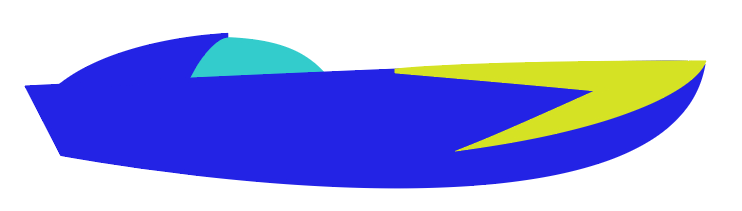
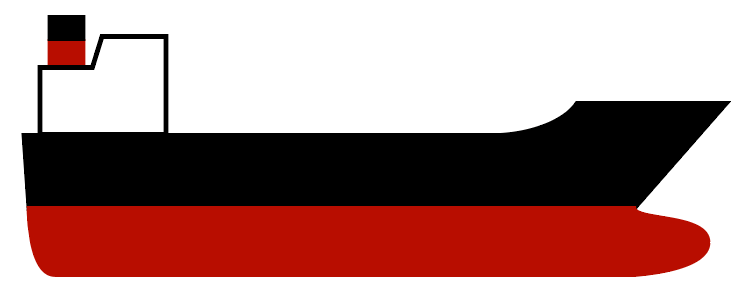
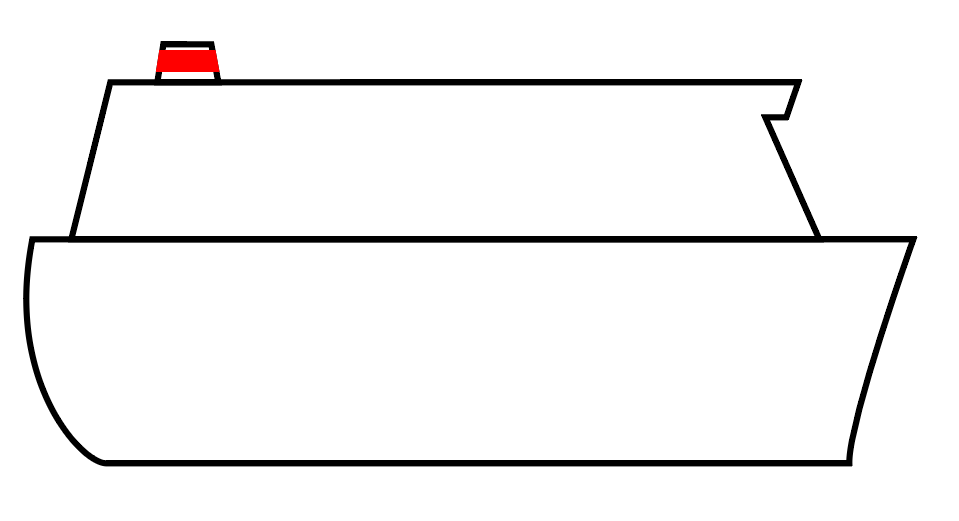
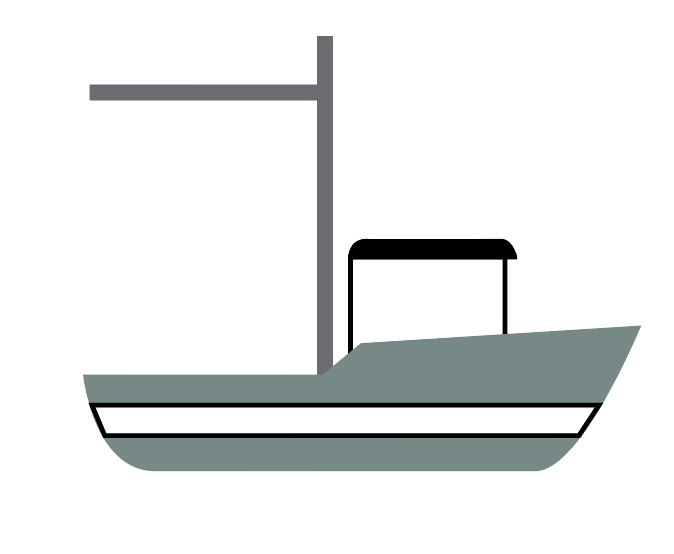
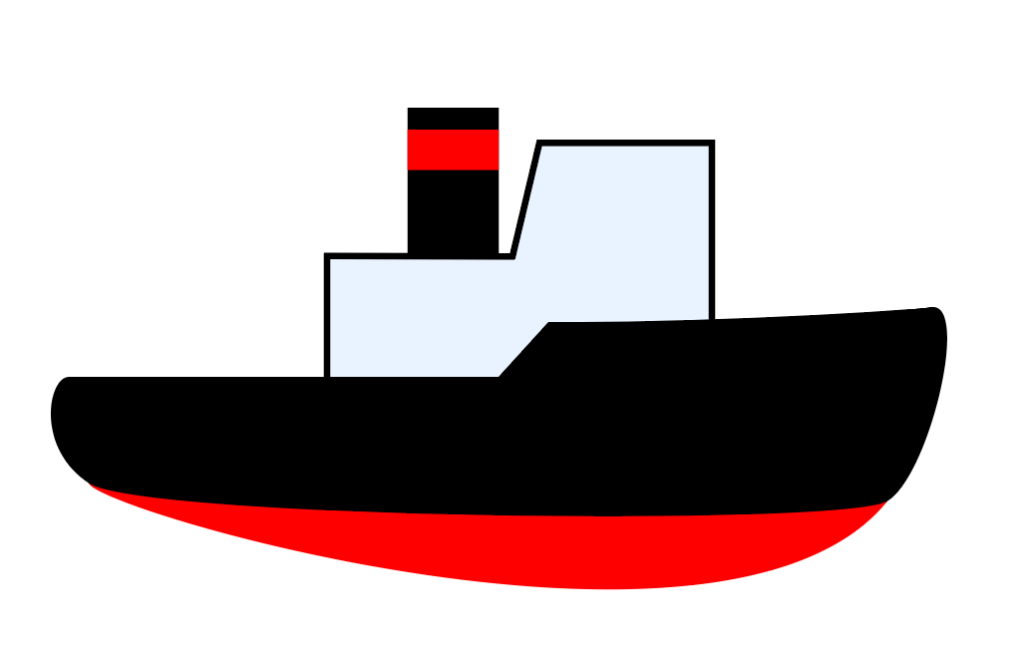
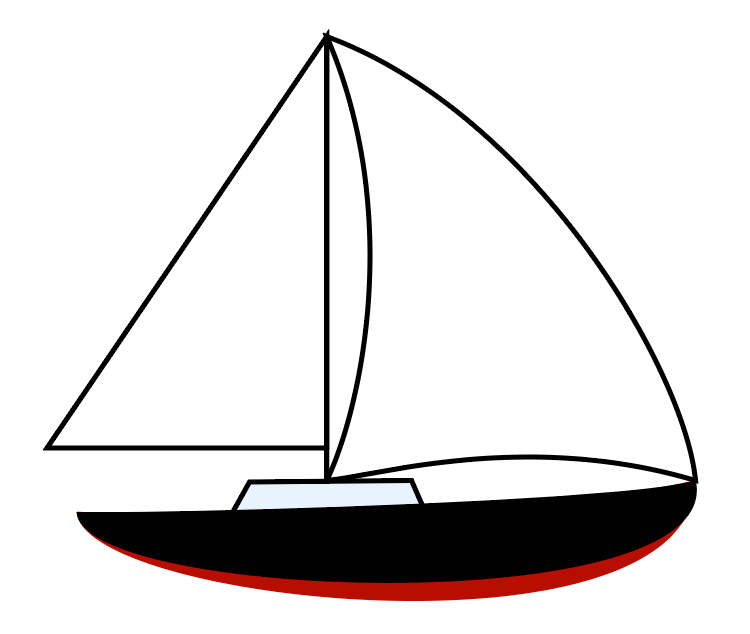
For our second assignment in Art 48, we’re doing an animated infographic. For mine, I chose the Port of Long Beach as my topic. Specifically, the percentage of ships that visit it.
- Demonstrate the wide variety of boats and ships in Long Beach
- Show the percentage of ships using a pie chart
- Next to the pie chart, have short animations of the boats themselves
My target audience for this would be people who want to learn more about the port, whether they work there, are looking to invest, or are just curious.


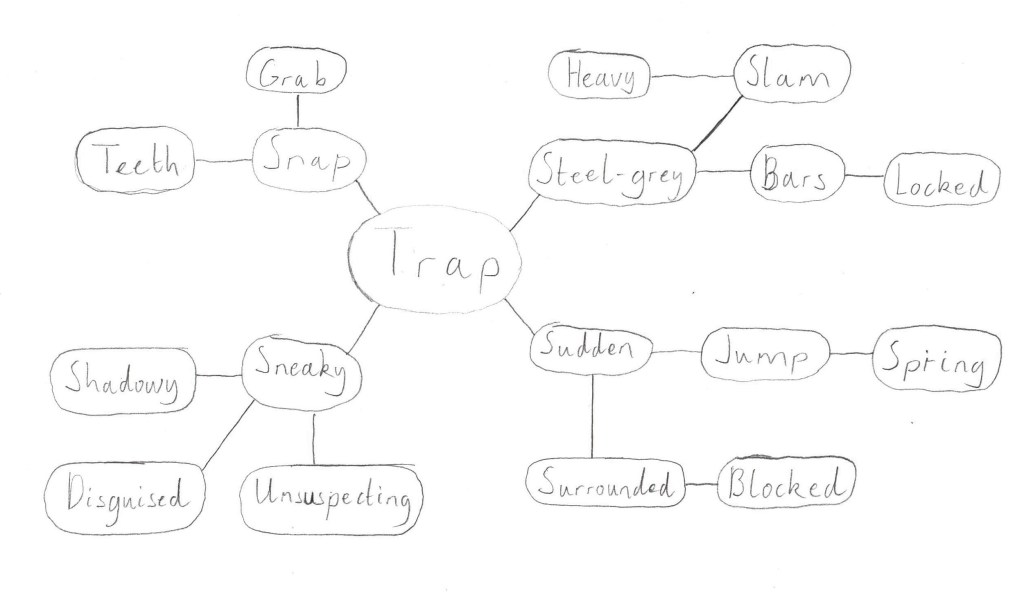
Trap Final
- For my animation, I chose to use the word ‘Trap’.
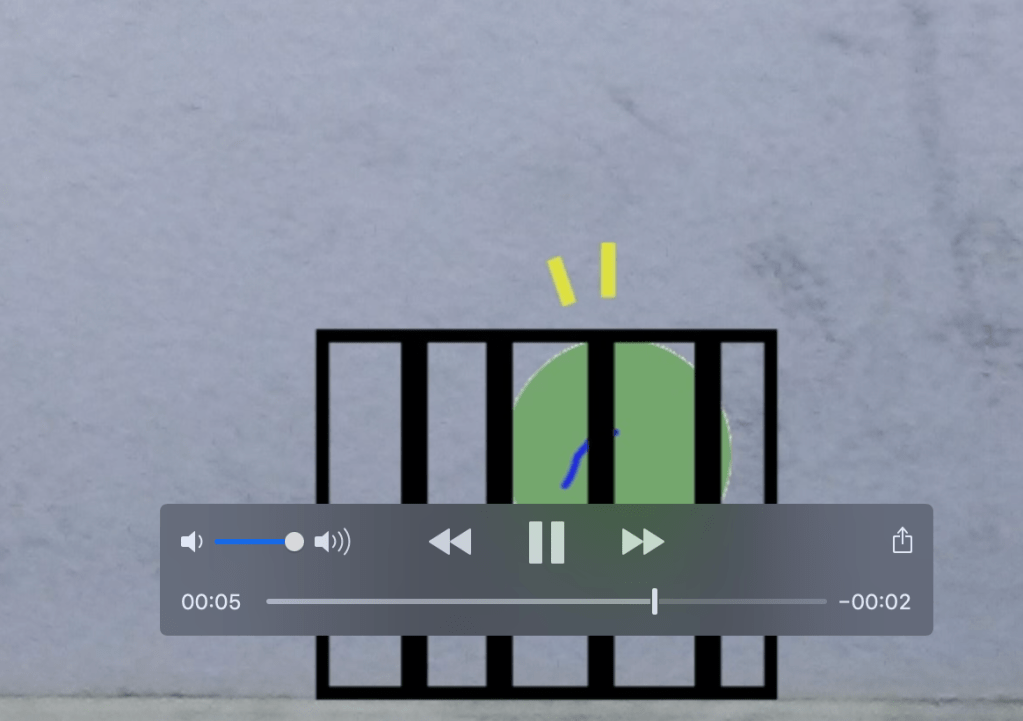
- To illustrate what I think of when I hear the word trap, I chose to animate a ball rolling into a cage trap.
- The ball rolls until it triggers the trap, which falls on it. After the ball bounces around inside for a moment, the cage ascends back off-screen with the ball inside.